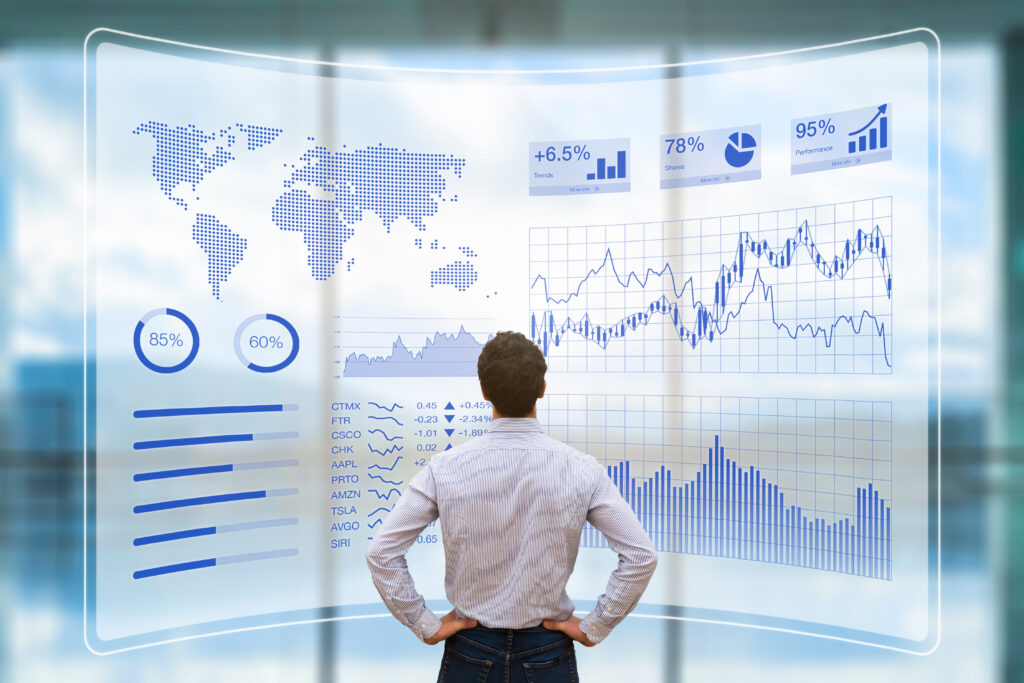
The supply chain has always been rich with data. Historically, time delays and large amounts of manual effort to gather this data have limited its usefulness. But with the smart factory and IoT enabling the real-time collection of huge volumes of information, getting an understanding of this data has become more important than ever.
By collecting, analysing, and visualising data, trends and outliers become clear, and excellence can be achieved throughout the supply chain. Put simply, data visualisation leads to better access to data and supports improved decision-making.
Determine the right KPIs
The correct KPIs can show the health of a business and will measure its performance over time. They can be used across an organisation to evaluate the performance of a specific team, process or product. The insights gained by these metrics allow businesses are the key to all efficiencies and improvements that can be gained. Deciding on the most valuable metrics and clearly visualising them for each team is vital to the successful performance of the supply chain.
See our article on the best KPIs to optimise the supply chain.
Efficiently respond to challenges
From procurement and manufacturing to logistics and sales, it is important not only to fix problems in the supply chain but to fix them efficiently. With data being collected in real-time, it is important to give visibility to what is happening all along the supply chain, respond to issues as they arise, and efficiently allocate resources to maintain a smoothly running supply chain. Data visualisations can create powerful monitoring and decision-support tools to empower supply chain managers to make the best decisions as quickly as possible.
Make the data widely available
For any industry working across the supply chain, whether it’s manufacturing, pharma, tech or logistics, data can inform decision making across every layer of the business.
A common challenge among businesses is having so many processes to measure, and some much data to inform decisions. Without clear insight into the relevant data, teams will never be able to make any sense of the measures they are tracking. Without the capability to view all measures on a single dashboard, the data generated won’t yield any clear insights into performance or where efficiencies can be gained.
All data collected is useful, but it will only help drive change when the correct teams use the correct data. Middle managers and supervisors may be more concerned with a major breakdown in an individual machine or process, but higher level managers may see a larger trend of one machine underperforming. This can show when one machine needs a service or part replacement, and the overall process can be improved.
Data visualization can show the bigger picture rapidly. With strong dashboards, operations managers can drill down to specific measures in a few clicks, see their exact composition, and even zero in on specific issues.
By visualising the correct data for the teams tasked with overseeing a process, each team can gain relevant insights and improve processes in their area. With the global supply chain being under immense pressure in recent years, even small improvements can lead to large gains.
Automating efficiency
As collection and visualisation tools become more advanced, machine learning will also increase automation in the supply chain, allowing human resources to be redeployed elsewhere.
With clear parameters for acceptable performance built into these visualisation platforms, accountability can be automated. Simple traffic light notifications show when a process isn’t performing, and automated emails or messaging can notify a relevant team member when they need to act on a potential issue. This notification can also be tracked, meaning that team member is clearly responsible for assessing or fixing an issue, achieving the long sought for the goal of automating accountability and efficiency.
Gain true insights with WrxFlo
WrxFlo will become your partner to deliver improvements across all your people, processes and technologies. We will help you define the correct KPIs, implement IoT to track processes and integrate with your existing systems, and then help you visualise the correct data for every level of your team. With our platform, you can automate accountability and gain data insights right away.
Start your digital transformation and request a demo today.


